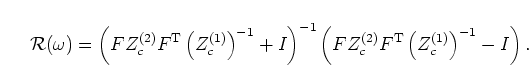
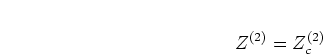
The simplest case of a multimodal calculation of the reflectance matrix
is for the reflection of plane waves
from a single discontinuity in cross-section between two
semi-infinite cylinders. We will define the plane on the left of the
discontinuity as plane 1 and
the plane on the right as plane 2 (see figure 2.2).
If a plane sine-wave is incident from the left,
it will be partially reflected and partially transmitted at the boundary.
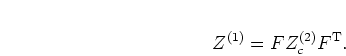
The impedance matrix on the right hand side of the boundary will be equal to
the characteristic impedance matrix because only
forward propagating waves are present there:
 |
(6.9) |
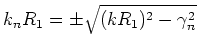
If particular values of the cylinder radii, ![]() and
and ![]() are chosen, the
reflectance matrix can be calculated for a number of frequency values.
However, as with the radiation impedance
calculations in chapter 3, the results may be presented in a
form valid for all radius values by reformulating the equations in terms of
the dimensionless frequency variable
are chosen, the
reflectance matrix can be calculated for a number of frequency values.
However, as with the radiation impedance
calculations in chapter 3, the results may be presented in a
form valid for all radius values by reformulating the equations in terms of
the dimensionless frequency variable ![]() and the radius ratio
and the radius ratio
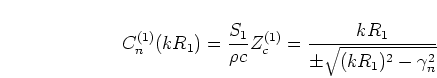
![]() . The characteristic impedance of
the
. The characteristic impedance of
the ![]() th mode on the left of the discontinuity becomes
th mode on the left of the discontinuity becomes
![]() where
where
 .
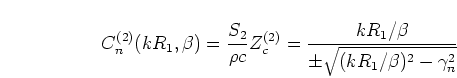
Dividing by
.
Dividing by ![]() normalises the characteristic impedance of the
normalises the characteristic impedance of the
![]() th mode to give
th mode to give
 |
(6.14) |
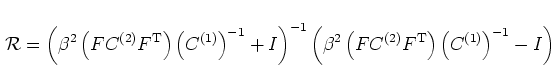
Before proceeding to produce graphs from the reflectance matrix we
should consider which elements determine the reflected sound.
For our example we have a plane sine-wave of unit amplitude incident on the
discontinuity from the left. This forward travelling wave is represented by
 |
(6.15) |
 |
(6.16) |
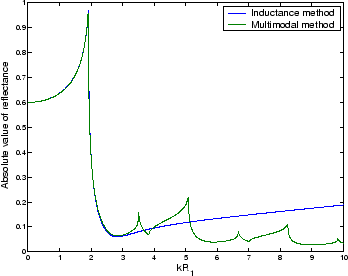
Figure 6.1 displays
the absolute value of the plane reflectance for radius ratio of ![]() against the dimensionless frequency variable,
against the dimensionless frequency variable, ![]() as a green line.
At low frequencies the
plane reflectance matches the plane wave reflection coefficient of
equation (2.20) which is
as a green line.
At low frequencies the
plane reflectance matches the plane wave reflection coefficient of
equation (2.20) which is ![]() for
for
![]() .
The maximum in the graph corresponds to the cut-off of the first
non-plane mode in the larger of the ducts. A blue line
shows the absolute value of the plane reflectance from the
inductance method published by Kergomard and Garcia [57].
The use of the inductance method to calculate reflectance is summarised in
appendix C.
The inductance method is designed to be accurate in the region
.
The maximum in the graph corresponds to the cut-off of the first
non-plane mode in the larger of the ducts. A blue line
shows the absolute value of the plane reflectance from the
inductance method published by Kergomard and Garcia [57].
The use of the inductance method to calculate reflectance is summarised in
appendix C.
The inductance method is designed to be accurate in the region ![]() ,
ie.
,
ie. ![]() in this example. Agreement between the inductance method and
the current multimodal method is very good in this region.
in this example. Agreement between the inductance method and
the current multimodal method is very good in this region.
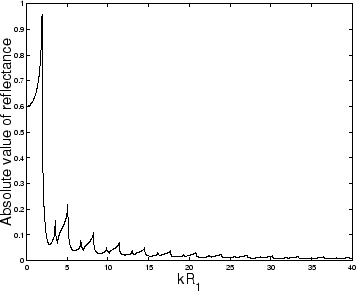
Figure 6.2 shows the plane reflectance
decaying to zero at high frequencies. We can understand this by noting that
high frequencies do not experience much diffraction meaning almost
100![]() of the energy is transmitted across an expansion.
of the energy is transmitted across an expansion.
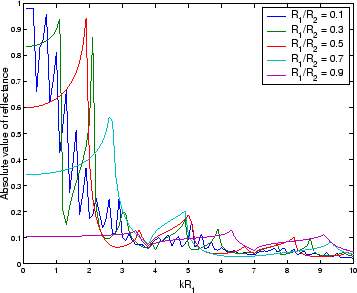
Figure 6.3 shows the plane reflectance
against frequency for a number of different radius ratios. The low
frequency limit shows that large cross-section changes reflect
more energy in agreement with the plane wave approximation reflection
coefficient. Large cross-section changes also lead to a quicker drop off of
plane reflectance with frequency. The detail in the graphs can be understood
by considering the cut-off frequencies in the smaller pipe (section 1)
and the larger pipe (section 2).
The cut-off wavenumber for the ![]() mode in section 1 is
mode in section 1 is
![]() and the
and the ![]() cut-off in section 1 is
cut-off in section 1 is
![]() .
We can see all the graphs have small minima at these values. The large peaks,
however, are due to the cut-off frequencies in the pipe on the right.
.
We can see all the graphs have small minima at these values. The large peaks,
however, are due to the cut-off frequencies in the pipe on the right.
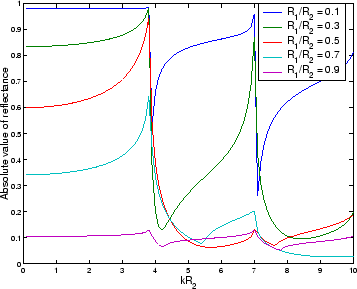
In order to show the cut-off frequencies on surface 2, the graphs are replotted
using a dimensionless frequency variable of
![]() . The
resulting plot is shown in figure 6.4.
The lowest cut-off wavenumber present is for the
. The
resulting plot is shown in figure 6.4.
The lowest cut-off wavenumber present is for the ![]() mode in section 2
with a dimensionless frequency of
mode in section 2
with a dimensionless frequency of
![]() .
All the spectra show peaks at this point because above this frequency
energy is absorbed from the plane reflection by transmission into
the propagating mode. The reduction in reflected amplitude after the
.
All the spectra show peaks at this point because above this frequency
energy is absorbed from the plane reflection by transmission into
the propagating mode. The reduction in reflected amplitude after the ![]() cut-off frequency is particularly marked in the
cut-off frequency is particularly marked in the ![]() case.
The pressure profile of the
case.
The pressure profile of the ![]() mode on
mode on ![]() has a circular amplitude
maximum in the centre taking up an area similar to the pressure amplitude of
the plane mode on
has a circular amplitude
maximum in the centre taking up an area similar to the pressure amplitude of
the plane mode on ![]() .
Since the pressure profile on
.
Since the pressure profile on ![]() must match the pressure profile on
must match the pressure profile on
![]() , above the cut-off frequency strong transmission of the propagating
, above the cut-off frequency strong transmission of the propagating
![]() mode is favoured.
The
mode is favoured.
The ![]() mode in section 2 is responsible for the peaks at
mode in section 2 is responsible for the peaks at
![]() in the plane reflectance spectra.
in the plane reflectance spectra.